Saliency Thresholds in Neural Code and its Relation to the Power-Law, Gaussian, and Lambert W Function
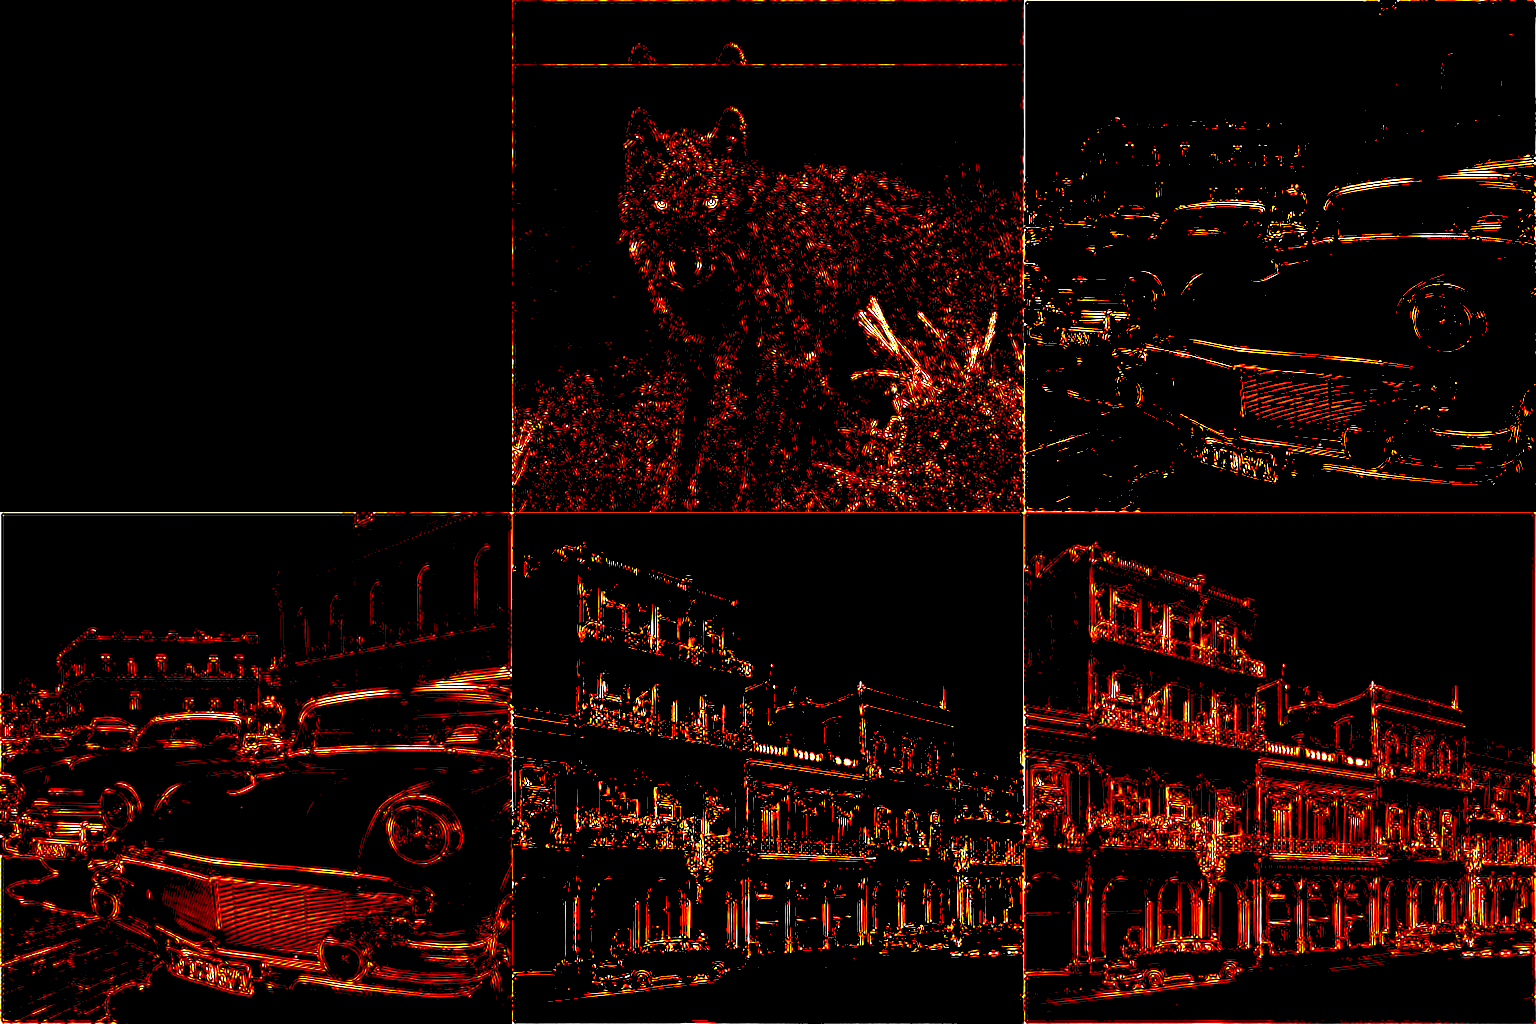
A saliency reveal from high-energy pixels toward lower-energy pixels.
Keywords: Power law, Gaussian, Lambert W function, saliency, neural code.
1. Introduction
The cortical neurons' response distribution is quite different from that of the natural stimulus, exhibiting a stereotypical shape. For example, the neural response distribution of primary visual cortex models similar to Geisler et al. (2001) that use Gabor filtering gives a power-law-like response distribution regardless of the stimulus, while the intensity distribution of the stimuli themselves vary widely. Recordings in visual cortical neurons in the macaque exhibit sparse activity, with high kurtosis Vinje and Gallant (2000). These response distributions have a characteristic heavy tail compared to a normal distribution: either lognormal, or alpha-stable family of distributions that include the power law Lehky et al. (2011).
Is there a functional significance to the response level at which the response distribution becomes heavy tail, i.e., the intersection point of the response distribution and the baseline Gaussian distribution? To answer this question, we will explore various computational results and theoretical open questions relating to this, most notably the relationship between power law, Gaussian, Lambert W function, and saliency thresholds in neural code.
2. Background and Related Works
Lee and Choe (2003) made the first discovery of the power-law-like heavy-tail response property and its functional significance in visual cortical response models based on Geisler et al. (2001). The model was a simple series of convolutions, first with a difference-of-Gaussian to simulate the lateral geniculate nucleus, followed by orientated Gabor filters to mimic primary visual cortical response, giving \(E\), the orientation energy.
There were three main findings in this paper: (1) the response has a power-law-like distribution, (2) when compared to a Gaussian distribution with equal standard-deviation, the larger intersection point, \(L_2\), is linearly correlated with the saliency threshold of the response when compared to the human selected threshold, and (3) the \(L_2\) intersection point is linearly correlated with the standard deviation of the response. In fact, it was determined that the threshold can be approximated \(\theta = 1.37\sigma - 2176.69\), simply using the standard deviation of the response \(\sigma\).
The Gaussian sounds like a good first approximation as a baseline, but why does it make sense as a baseline? Sarma and Choe (2006) showed that when the same visual cortical response model is presented with white-noise images, the response distribution mimics the Gaussian. This provides empirical justification, since white-noise images do not have any salient edges.
3. Further Observations with Recurrent CNN
Such power-law response we have seen above is not limited to the orientation energy model. Experiments with a biologically motivated cortical map model known as GCAL, or gain control, adaptation, and lateral, also resulted in power-law-like response in the model trained with natural images Park et al. (2009).
An interesting question is whether modern deep learning vision models like the Convolutional Neural Networks LeCun et al. (1989) and Krizhevsky et al. (2012) exhibit similar power-law-like response, since it is well-known that the convolution kernels in the CNN trained with natural images resemble those in V1 Zeiler and Fergus (2014).
The initial answer is no, since our first attempt resulted in a Gaussian-like response distribution. However, incorporating the lateral connections, or horizontal connections, in the visual cortex as in the GCAL model Stevens et al. (2013), we were able to elicit a power-law response distribution using the CNN. An existing model called Recurrent CNN Liang and Hu (2015) can be reinterpreted as implementing lateral connections. Using this, we conducted three experiments with results showing that when the network is untrained, or when white-noise images are presented to a trained RCNN, regardless of the number of loops, the response is Gaussian. When natural images are presented to a trained RCNN, initially the response is close to Gaussian, but as the loop increases it approaches the power law.
4. Relation to Lambert W Function and Invariance in Neural Thresholding
In an attempt to compute \(L_2\) analytically, another ubiquitous mathematical function emerged, the Lambert W. The Lambert W function is a function \(W(z)\) satisfying \(W(z)e^{W(z)} = z\). Note that this is similar to \(e^{\ln(x)} = x\), and it can be thought of as an extended log function: \(y = e^x\) and \(y = xe^x\) vs. \(\ln(x)\) and \(W(x)\), respectively. With this, we can attempt to solve:
which then gives:
where \(c\) is a normalization factor, \(a\) is the power law exponent, and \(\sigma\) is standard deviation. In case responses are non-negative, let the baseline be a half-normal distribution.
Just like the power law and Gaussian, the Lambert W function seems ubiquitous in science and engineering Katsimpiri et al. (2016) with multiple applications in pure and applied mathematics, including solving transcendental equations where the unknown appears both in an exponential, such as the exponentially decaying tails of the Gaussian, and algebraically, such as the polynomially decaying tails of the power law Corless et al. (1996). In nature, the Lambert W emerges naturally in instances where exponential processes and polynomial processes meet, including brain oxygen and BOLD coupling, enzyme kinetics, and evolutionary models.
Next, the observation that the intersection point \(L_2\) is also linearly correlated with the standard deviation of the response seems to point to an invariant property regardless of the input stimulus, i.e. \(\frac{\theta}{\sigma} = c\), where \(\theta\) is the saliency threshold, \(\sigma\) is the standard deviation, and \(c\) is some constant. This kind of invariance can greatly simplify downstream processing in the visual system. Furthermore, the threshold can be readily computed: Lee and Choe (2003) observed that \(\sigma\) can be easily computed in neural circuits, given quadratic activation functions and square root activation functions. An open-ended question is whether this kind of approach is universal, e.g., employed across different sensory modalities, and different levels of processing.
5. Conclusion
The contribution of this extended abstract in the context of existing works can be summarized as follows:
1. Known result: the relationship between power-law-like neural response and the use of the Gaussian as a baseline for saliency threshold.
2. Known result: linear correlation among perceptual threshold, intersection point of power-law vs. Gaussian, and standard deviation of the response.
3. New computational results: Recurrent CNN activity starts with Gaussian-like and progressively becomes power-law-like through the loops.
4. New theoretical insights: Lambert W function provides an analytical solution for the computation of the intersection point.
This leads to 5. Open-ended questions: deep fundamental entanglement among power-law, Gaussian, Lambert W function, and thresholds in neural code, and potential connections to criticality and self-organization in nature Beggs (2022).
References
Beggs, J. M. (2022). The cortex and the critical point: understanding the power of emergence. MIT Press.
Corless, R. M., Gonnet, G. H., Hare, D. E., Jeffrey, D. J., & Knuth, D. E. (1996). On the Lambert W function. Advances in Computational Mathematics, 5(1), 329-359.
Geisler, W. S., Perry, J. S., Super, B. J., & Gallogly, D. P. (2001). Edge co-occurrence in natural images predicts contour grouping performance. Vision Research, 41, 711-724.
Katsimpiri, C., Nastou, P. E., Pardalos, P. M., & Stamatiou, Y. C. (2016). The ubiquitous Lambert function and its classes in sciences and engineering. In Contributions in Mathematics and Engineering: In Honor of Constantin Caratheodory (pp. 323-342). Springer.
Krizhevsky, A., Sutskever, I., & Hinton, G. E. (2012). ImageNet classification with deep convolutional neural networks. In Advances in Neural Information Processing Systems (Vol. 25).
LeCun, Y., Boser, B., Denker, J., Henderson, D., Howard, R., Hubbard, W., & Jackel, L. (1989). Handwritten digit recognition with a back-propagation network. Advances in Neural Information Processing Systems, 2, 396-404.
Lee, H. C., & Choe, Y. (2003). Detecting salient contours using orientation energy distribution. In Proceedings of the International Joint Conference on Neural Networks (pp. 206-211). IEEE.
Lehky, S. R., Kiani, R., Esteky, H., & Tanaka, K. (2011). Statistics of visual responses in primate inferotemporal cortex to object stimuli. Journal of Neurophysiology, 106(3), 1097-1117.
Liang, M., & Hu, X. (2015). Recurrent convolutional neural network for object recognition. In Proceedings of the IEEE Conference on Computer Vision and Pattern Recognition (pp. 3367-3375).
Park, C., Bai, Y. H., & Choe, Y. (2009). Tactile or visual?: Stimulus characteristics determine receptive field type in a self-organizing map model of cortical development. In Proceedings of the 2009 IEEE Symposium on Computational Intelligence for Multimedia Signal and Vision Processing (pp. 6-13).
Sarma, S., & Choe, Y. (2006). Salience in orientation-filter response measured as suspicious coincidence in natural images. In Proceedings of the 21st National Conference on Artificial Intelligence (pp. 193-198).
Stevens, J. L. R., Law, J. S., Antolik, J., & Bednar, J. A. (2013). Mechanisms for stable, robust, and adaptive development of orientation maps in the primary visual cortex. Journal of Neuroscience, 33(40), 15747-15766.
Vinje, W. E., & Gallant, J. L. (2000). Sparse coding and decorrelation in primary visual cortex during natural vision. Science, 287(5456), 1273-1276.
Zeiler, M. D., & Fergus, R. (2014). Visualizing and understanding convolutional networks. In European Conference on Computer Vision (pp. 818-833). Springer.